| Vote Preference | Breakdown by Party Affiliation |  |
|
||||||
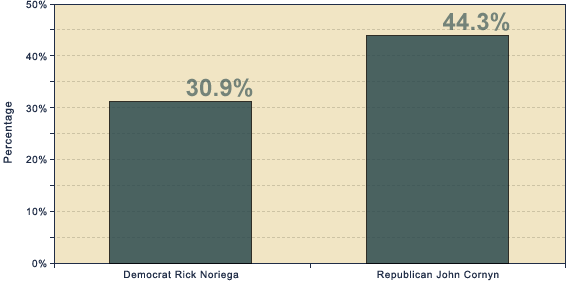
Preferences of registered voters (n=602). 24.8% of these respondents chose "I don't know".
| Vote Preference | Breakdown by Party Affiliation | |
|
||||||
Preferences of registered voters (n=602). 24.8% of these respondents chose "I don't know".