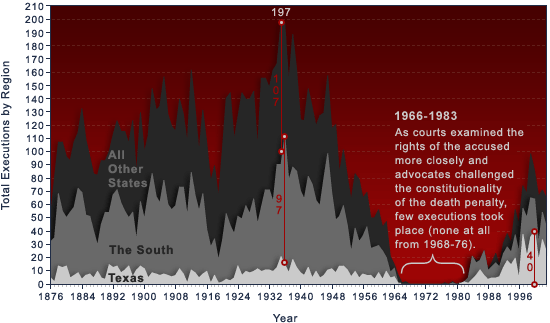
| Annual Number of Executions Carried Out by Civil Authority in Texas, the South, and Other States, 1876-2003 |

|
A state can legally kill you. So observes one apt paraphrase of Max Weber's famous definition of a state. This chart plots the truth of that definition in the total annual number of executions in Texas, the non-Texas South, and in all other states stacked so that the total area indicates total annual executions nationwide. In 2000, the state of Texas executed 40 people, more than in any year before or since. By comparison, executions nationwide peaked in 1935 at 197. That year also was the high water mark for non-southern states with 107 executions. Southern states, excluding Texas, reached a peak the next year, 1936, when 97 were executed across the region. From that point the annual number of executions dropped steadily until litigation over the death penalty brought executions to a full stop between 1968-1976. Following the Supreme Court's ruling that death as a criminal penalty was not intrinsically cruel and unusual in Furman v. Georgia (1972), many states rewrote their death penalty laws to satisfy the Court's requirements. In 1977 Utah reinstituted capital punishment, executing Gary Gilmore by firing squad. Since 1984, driven chiefly by Texas with a push from other, predominantly southern states, the number of executions annually has trended upward. Texas and the rest of the South account for more than 72 percent of all executions since 1984. |
|
Source: Espy File; Bureau of Justice Statistics. (full source) |
1977-2003: "Prisoners executed under civil authority in the United States, by year, region, and jurisdiction, 1977-2003," compiled by the Bureau of Justice Statistics as part of the National Prisoner Statistics data series (NPS-8). Accessed 16 September 2004 at http://www.ojp.usdoj.gov/bjs/cp.htm.