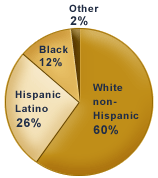
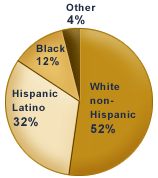
| The Demographics of Race and Ethnicity in Texas 1990 and 20001 | ||||||||||||||||||||||||||||||||||||||||||||||||||||||||||||||||||||||||||||||||||||||||||||||||||||||||
|
||||||||||||||||||||||||||||||||||||||||||||||||||||||||||||||||||||||||||||||||||||||||||||||||||||||||
|
||||||||||||||||||||||||||||||||||||||||||||||||||||||||||||||||||||||||||||||||||||||||||||||||||||||||
| Source: US Census Bureau; Texas State Data Center. (full source, footnote 1 and 2) | ||||||||||||||||||||||||||||||||||||||||||||||||||||||||||||||||||||||||||||||||||||||||||||||||||||||||
Full Source: 1990 and 2000 U.S. census data from http://www.census.gov/ and
the Texas State Data Center at http://txsdc.tamu.edu/.
1. Census 2000 terminology and categories are used for data on race. Because of methodological differences, 1990 and 2000 figures are not strictly conparable.
2. Since individuals could report only one race in the 1990 census and one or more in 2000, this category includes all other single-race responses not included in the previous categories, multi-race responses, and write-in entries. Most of this group in Texas, as nationwide, identified themselves as Hispanic or Latino in answer to the race question in 2000 or in a separate ethnicity question in 1990.

