| Employment | Income |  |
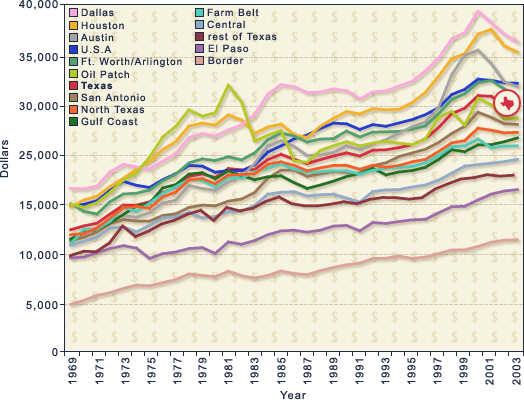
Source: BEA. (full source, footnote)
Full Source: Per capita income data in constant dollars for all Texas
counties, metropolitan areas, and the United States is from the U.S.
Bureau of Economic Analysis available at
http://www.bea.gov/bea/regional/reis/, accessed 19 July 2005. Current
dollars were converted to constant (2004) dollars using a conversion
factor that adjusts for changes in the national consumer price index
(CPI). More information on the conversion factor used is available at
http://oregonstate.edu/dept/pol_sci/fac/sahr/sahr.htm, accessed 25 July
2005. A gross domestic product (GDP) deflator which adjusts for broader
basket of prices than those that make up the CPI may be used for the
same purpose. It yields slightly different estimates of current income
levels in each year but the relative changes year-to-year and the
overall trends remain much the same. A table of historical and current
GDP deflators are available in 2005 Budget of the U.S. Government at
http://www.gpoaccess.gov/usbudget/fy05/hist.html, Table 10.1--Gross
Domestic Product and Deflators Used in the Historical Tables: 1940-2009,
accessed 13 July 2005.
Full Footnote: Per capita income figures for each region are averages of data for Texas metropolitan statistical areas (MSAs). As in the first slide, we follow the Dallas Fed's practice of grouping smaller MSAs for reporting purposes. Regions featured in the line chart as the same as those in the pie chart of the first slide. The MSAs they include are as follows: Houston-Baytown-Sugar Land MSA; Dallas-Plano-Irving MSA; San Antonio MSA; Ft Worth/Arlington MSA; Austin-Round Rock MSA; Border: Laredo MSA, Brownsville-Harlingen MSA, and McAllen-Edinburg-Pharr MSA; Central: Waco MSA, College-Station-Bryan MSA, and Killeen-Temple-Fort Hood MSA; Farm Belt: Abilene MSA, San Angelo MSA, Amarillo MSA, and Lubbock MSA; Gulf Coast: Beaumont-Port Arthur MSA, Corpus Christi MSA, and Victoria MSA; North Texas: Longview MSA, Tyler MSA, Sherman-Denison MSA, and Wichita Falls MSA; Oil Patch: Midland MSA and Odessa MSA.
Full Footnote: Per capita income figures for each region are averages of data for Texas metropolitan statistical areas (MSAs). As in the first slide, we follow the Dallas Fed's practice of grouping smaller MSAs for reporting purposes. Regions featured in the line chart as the same as those in the pie chart of the first slide. The MSAs they include are as follows: Houston-Baytown-Sugar Land MSA; Dallas-Plano-Irving MSA; San Antonio MSA; Ft Worth/Arlington MSA; Austin-Round Rock MSA; Border: Laredo MSA, Brownsville-Harlingen MSA, and McAllen-Edinburg-Pharr MSA; Central: Waco MSA, College-Station-Bryan MSA, and Killeen-Temple-Fort Hood MSA; Farm Belt: Abilene MSA, San Angelo MSA, Amarillo MSA, and Lubbock MSA; Gulf Coast: Beaumont-Port Arthur MSA, Corpus Christi MSA, and Victoria MSA; North Texas: Longview MSA, Tyler MSA, Sherman-Denison MSA, and Wichita Falls MSA; Oil Patch: Midland MSA and Odessa MSA.
