|
|
||||||
|
||||||
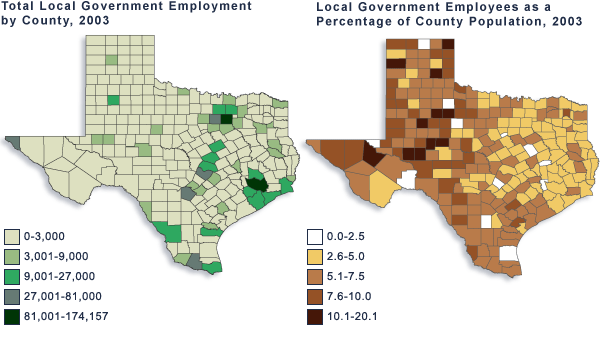
| Source: Bureau of Labor Statistics; Texas State Data Center. (full source, footnote) |
Full Source: Civilian government wage and employment data for 2003 is from
the Bureau of Labor Statistics, Census of Employment and Wages (CEW).
The raw data file for Texas is at
ftp://ftp.bls.gov/pub/special.requests/cew/2003/county/cn48tx03.zip,
accessed June 3, 2005. See the links at the CEW homepage at
http://www.bls.gov/cew/cewover.htm for further information. 2003 Texas
county population estimates are available online from the Texas State
Data Center at http://txsdc.utsa.edu/tpepp/2003_txpopest_county.csv,
accessed June 3, 2005. Note that in the 2003 CEW data, out of total
employment of more than 9.2 million, about 74,000 employees could not be
placed in any or any one county. These are excluded from the mapped
totals and percentages.

