A Look at the New School Finance Runs as HB3 Gets Debated on the House Floor
The Texas House will take up HB3, the omnibus school finance bill years in the making, on Wednesday. As with any attempt to tweak the school finance system in Texas, the attention of legislators in the House has shifted to the "runs", the document produced by the Legislative Budget Board outlining how funding will change for each member's school districts. Old timers in the process will remember how, in the past, when new runs were released, members walked around with sheafs of paper, looking for the small handful (or less) of members who could walk them through the implications.
Ah, technology! For those who enjoy looking at the data themselves and maybe even playing with it, we have converted the .pdf's released by the LBB into series of spreadsheets and shared them for easy access. The files are view-only in Google Drive, but they can be downloaded for individual use. We've also produced a searchable version of the compendium of pre-flied amendments made available at the legislature's website for those of you following along with the floor debate.
We have taken (only) a brief look at the impact of the current school finance bill on Texas' ISDs in 2020 (excluding charter school districts) as it stands before debate and likely amendment. (We haven't delved into equity and have not appended important information about school district demographics that might be useful for assessing whether districts with higher concentrations of low-income, or English as a second language, students are receiving equitable funding compared to districts with lower proportions of those same students. Nor do we consider expected changes in the enrollment numbers used to produce these runs, e.g. decreasing enrollment in Austin ISD and increasing enrollment in Round Rock ISD. Consider what is below somewhere beyond a hot take and well short of a full policy analysis. We're only looking at the 2020 numbers, knowing full well that things will change on Wednesday during debate, not to mention once the bill is addressed by the Senate, but we wanted to make the material is available for the debate.) So, with those (many) caveats aside, here are a few observations:
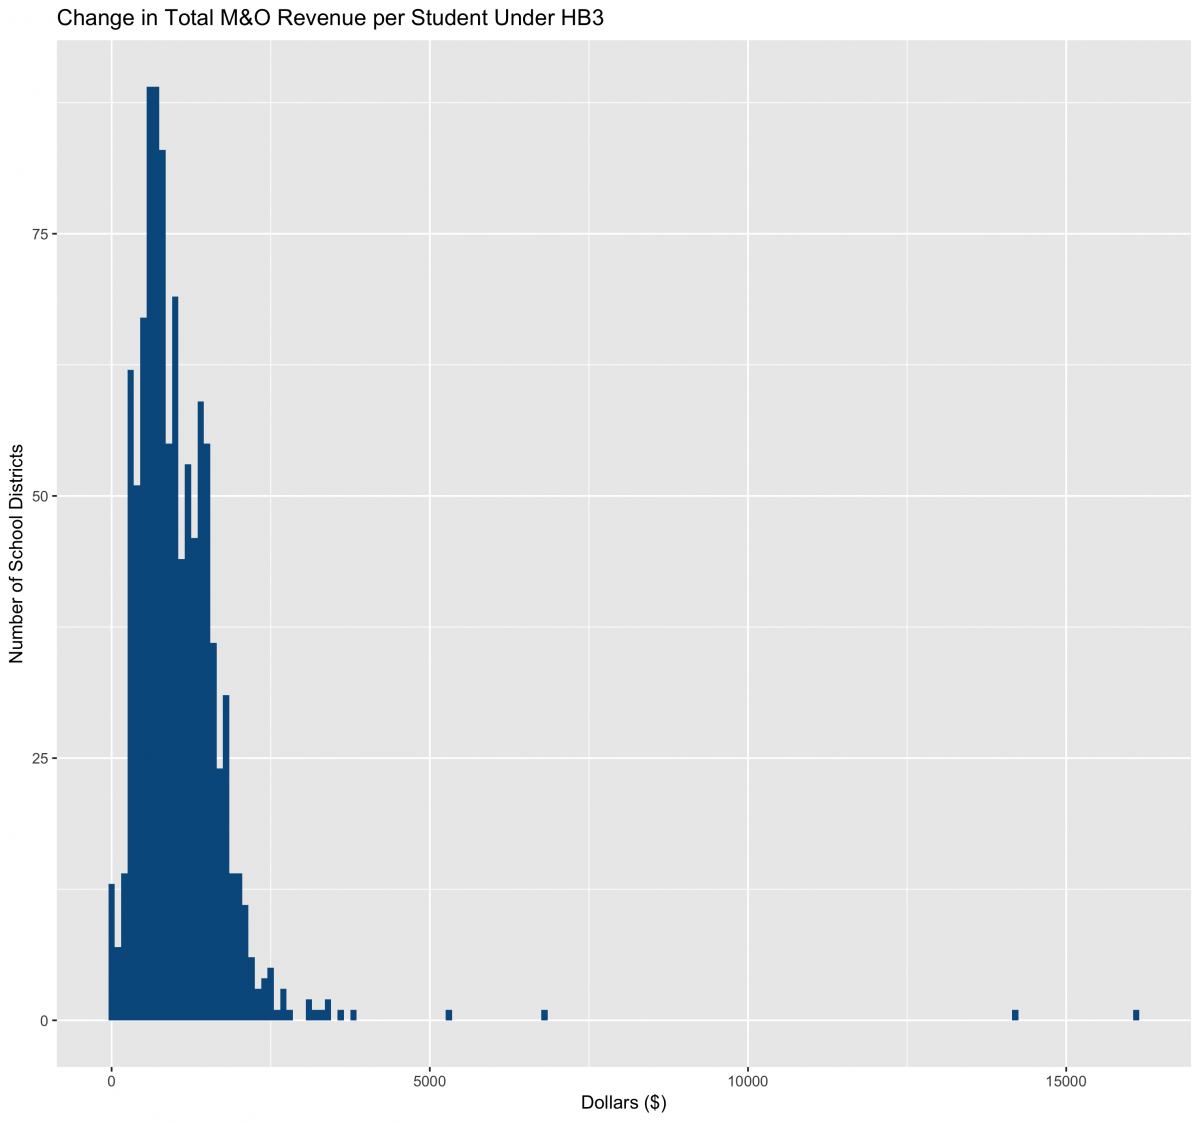
No school districts will see a decrease in M&O revenue per student (average daily attendance, or ADA) under HB3. In 2020, on average, ISD's will receive an additional $1,049 per student; the median increase per student is $920. Eighty-two percent of districts would see their M&O revenue per student increase by at least $500; 44% would see their M&O revenue per student increase by more than $1000. Only 3.3% would see an increase of under $250 per student. These numbers change in various ways in 2021.

In 2020, not surprisingly, the biggest per student increases would go to some of the smallest districts, such as Kenedy Countywide CSD, which would see a $16,140 increase in 2020, but which only has an ADA of 62; and Kelton ISD, which would see a $14,196 increase in 2020 with an ADA of 54.
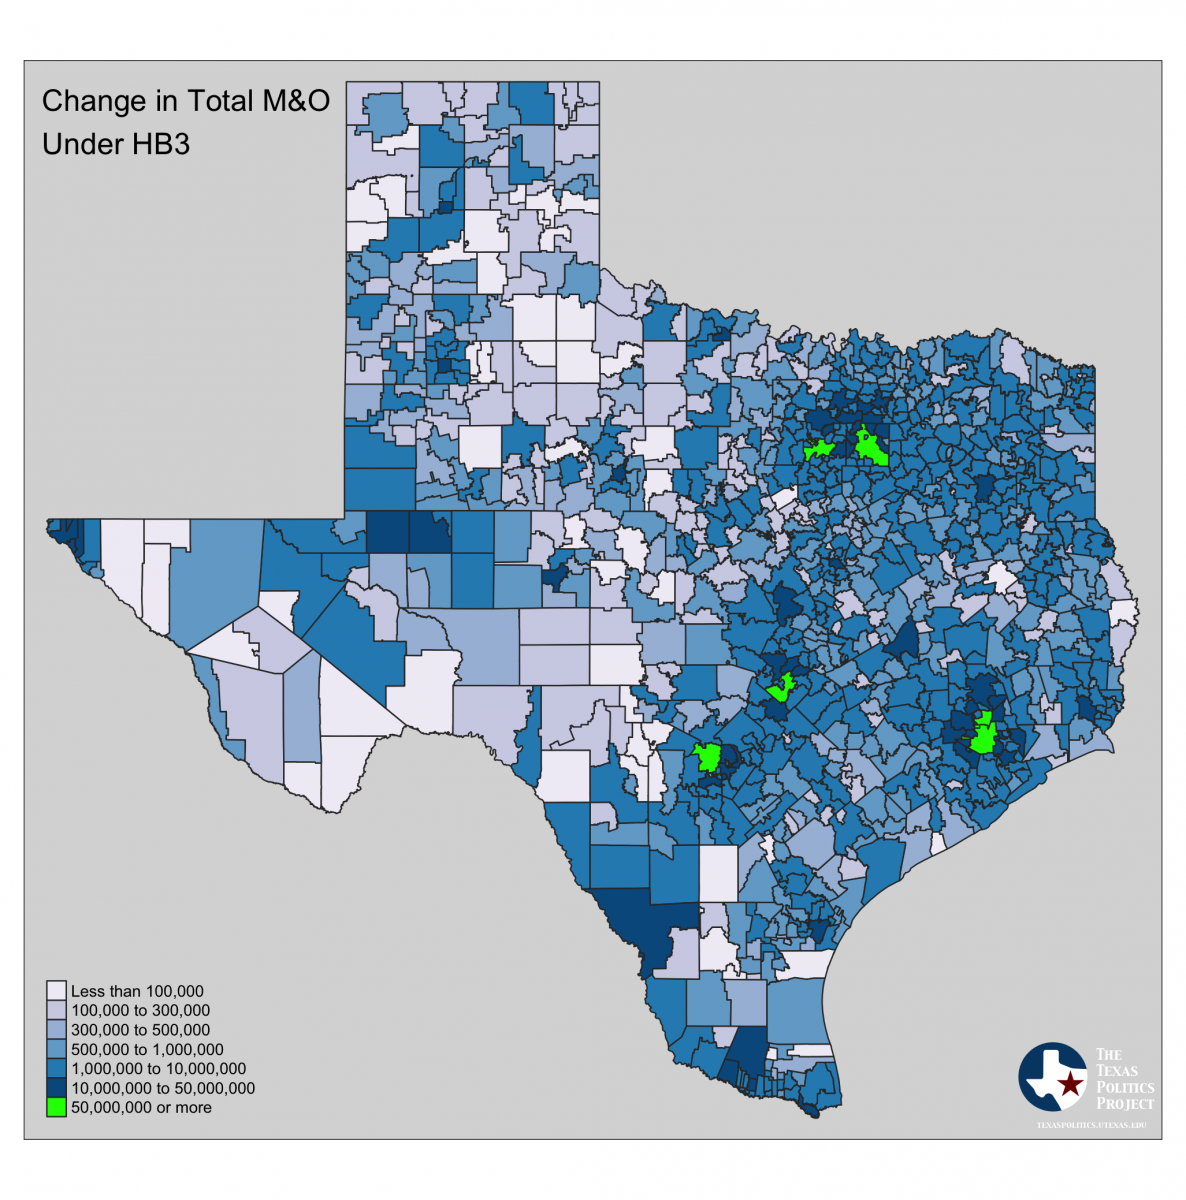
The districts that would see the largest 2020 increase in their overall M&O funding include the major metropolitan districts: Austin ISD ($126,548,566), Dallas ISD ($114,456,190), and Houston ISD ($85,034,812). The average change in overal M&O funding would be $3,015,183, with a median change of $913,572 (a better metric given the huge increases in the largest urban districts). Nonetheless, 70% of school districts would see M&O increases of $500,000 or more under HB3; 80% would see increases of $300,000 or more; and 95% would see increases of at least $100,000. Again, these amounts differ in 2021 due to changing inputs (like projected ADA).

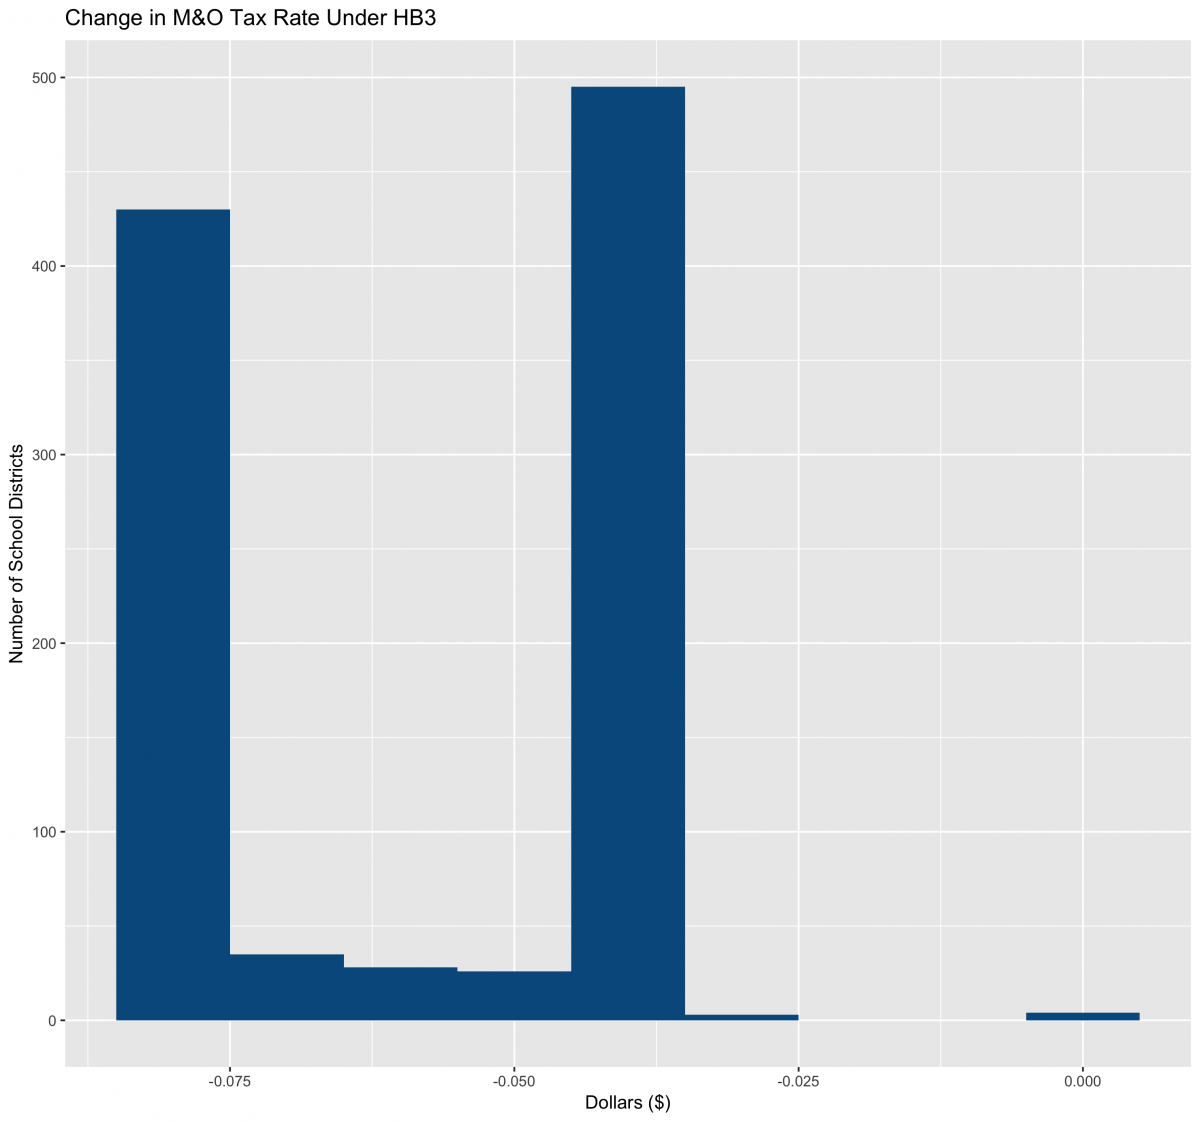
All but four school districts would see their M&O tax rates decrease, with a mean decrease of $0.06, a median of $0.05, and a maximum of $0.08.

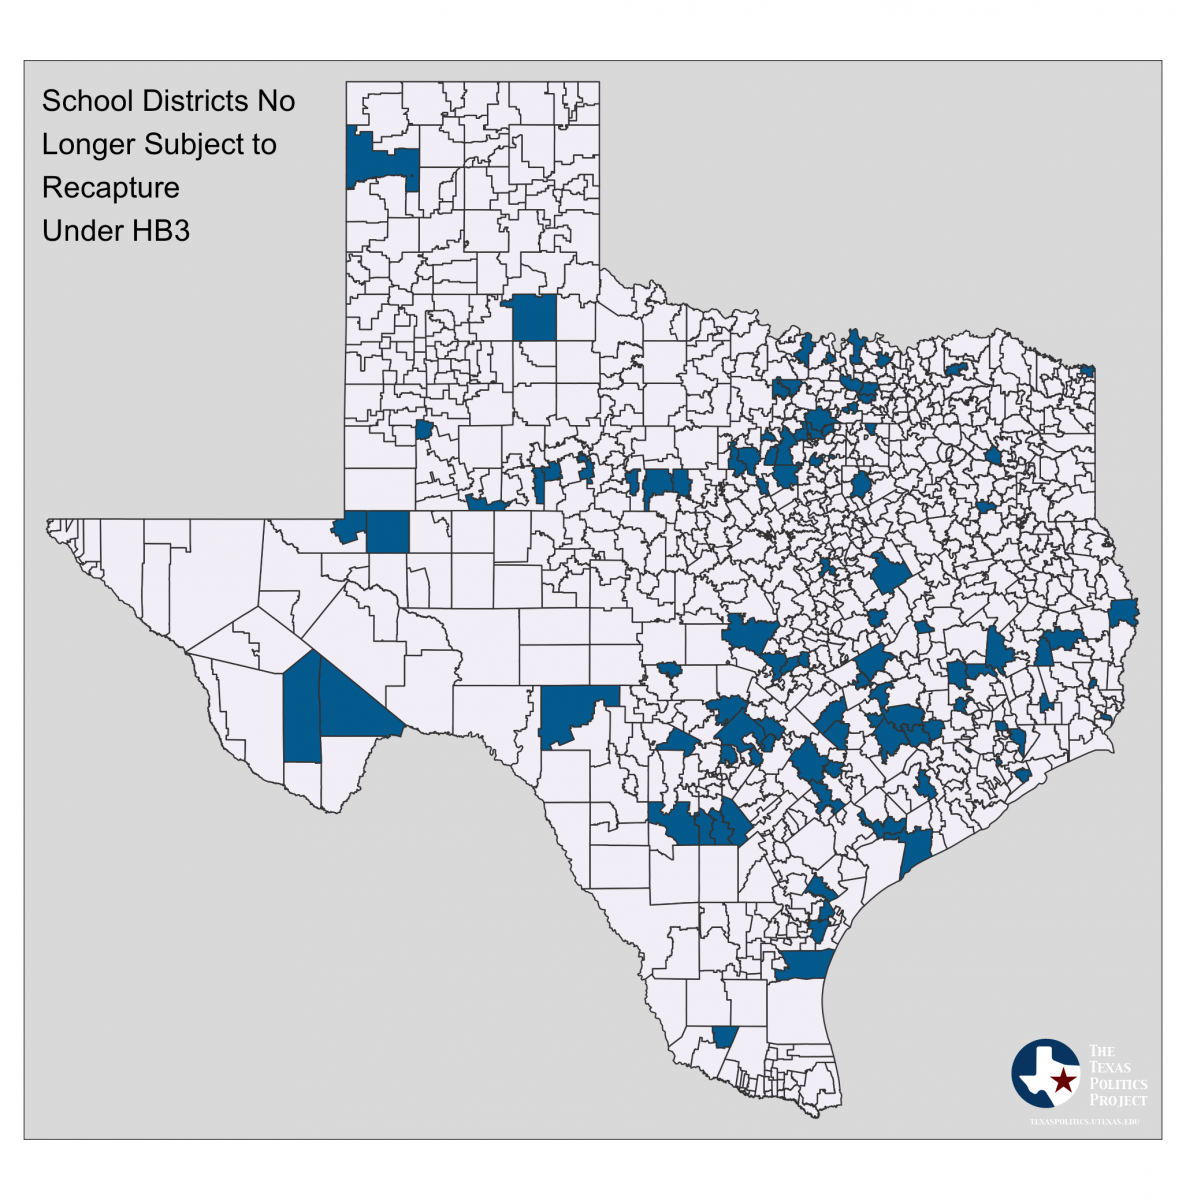
Under HB3, nearly 100 districts would have their recapture payments zeroed out, reducing the number districts making recapture payments from 240 school districts to 142. Amongst those districts currently making recapture payments, the average 2020 decrease under HB3 would be $5,966,644, though that figure is influenced by some large outliers (the median decrease in recapture payments would equal $608,514). Houston ISD would see its recapture payment drop by $236,215,976; Austin ISD by $194,113,183; Dallas ISD by $175,189,103; Plano ISD by $92,287,961; and Lewisville ISD by $56,478,291.

