A Quick Look at the School Finance Runs from HB 21 with Maps
The House Education Committee began hearings on HB 21 this week, the bill sponsored by Committee Chair Dan Huberty, intending to begin the process of changing Texas' beleaguered school financing system. Also released with the bill are were the "runs" for 2018 and 2019, the tables of legislative lore which show how the proposal would impact the operating budgets of each district compared to current law, including the impact that it would have on per student funding (according to the weighted average daily attendance for each district, aka the WADA). All of this action on public education in the House of Representatives made for a #Txlege study in contrasts that didn't feel very accidental on the same day that a marathon hearing of the State Affairs Committee, which ended in the wee hours of Thursday with a slightly modified version of SB 6, the so-called bathroom bill, passed out of committee.
We are by no means education policy or Texas school funding policy experts, but we like that the data have been released, and wanted to take a look at the runs to see if there's anything that we could learn. The runs provide a limited set of information and should be viewed carefully: they don't include any other changes that are occurring in the budget related to money going to districts, nor do they include grants and other revenue sources. Allowing for all this, if we appear to be erring in anything that we're presenting in the graphics below, email us with corrections. Given all these caveats, here are some initial observations.
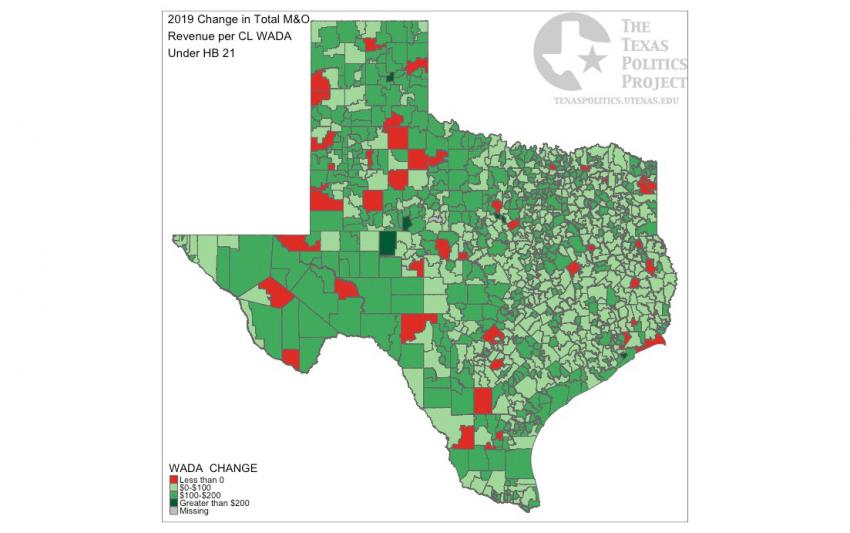
First, the sheer variance in school districts, however obvious, is striking. The largest independent school district, Houston ISD, has a WADA of 273,450, while the smallest, Divide ISD, has 86. The average size is 5,832 students, with the median being 1,392 (which, for those of you who don't think in statistics, means that there are some large school districts pulling up the average - Houston, Dallas, Northinside, Fort Worth, etc.). As for HB 21, according to this data (and again, we're just talking about the run sheets and nothing else), the average per student spending will increase by about $100 in 2018 and $99 in 2019. Fifty-four districts would lose funding in 2018 compared to current law, and 58 would lose funding in 2019 compared to the current law.
One question we were interested in asking is whether there's any clear regional geographic winners or losers under HB 21, and at least on first visual impression, the answer is no.


In addition to the maps, we can also take a quick look at the biggest winners and losers. Given the sizes discrepancies between districts, it makes sense to see which districts would see the biggest gains and losses in their per-student funding under the proposal.
| District | Change in per CL WADA |
|---|---|
| TEXAS CITY ISD |
$326 |
| GRANDVIEW-HOPKINS ISD | $276 |
| RED LICK ISD | $241 |
| STERLING CITY ISD | $240 |
| CORPUS CHRISTI MONTESSORI SCHO | $227 |
| SEASHORE MIDDLE ACAD | $227 |
| CHICO ISD | $226 |
| STEPHEN F AUSTIN STATE UNIVERS | $224 |
| COMPASS ACADEMY | $223 |
| TOMBALL ISD | $222 |
| WEBB CISD | $(182) |
| WESTPHALIA ISD | $(184) |
| GUTHRIE CSD | $(185) |
| KATHERINE ANNE PORTER SCHOOL | $(211) |
| GLEN ROSE ISD | $(241) |
| GUNTER ISD | $(257) |
| SOUTH TEXAS ISD | $(351) |
| BENJAMIN ISD | $(369) |
| RAMIREZ CSD | $(380) |
| SEMINOLE ISD | $(622) |
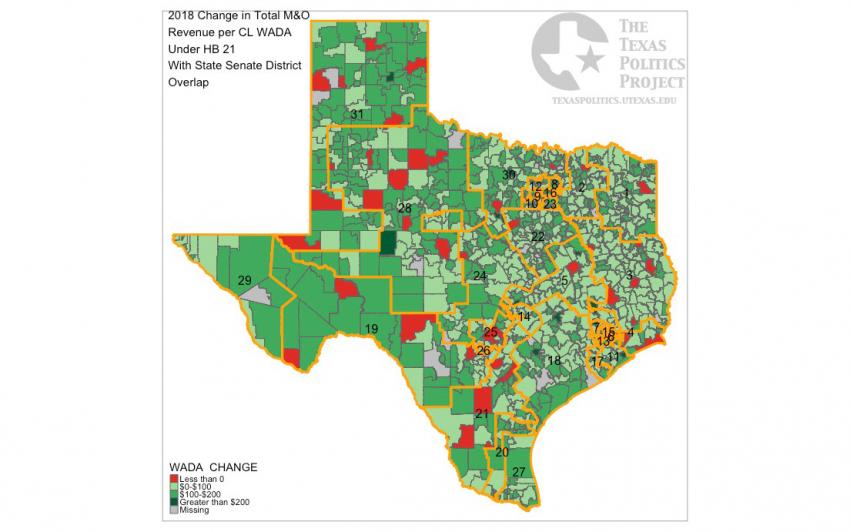
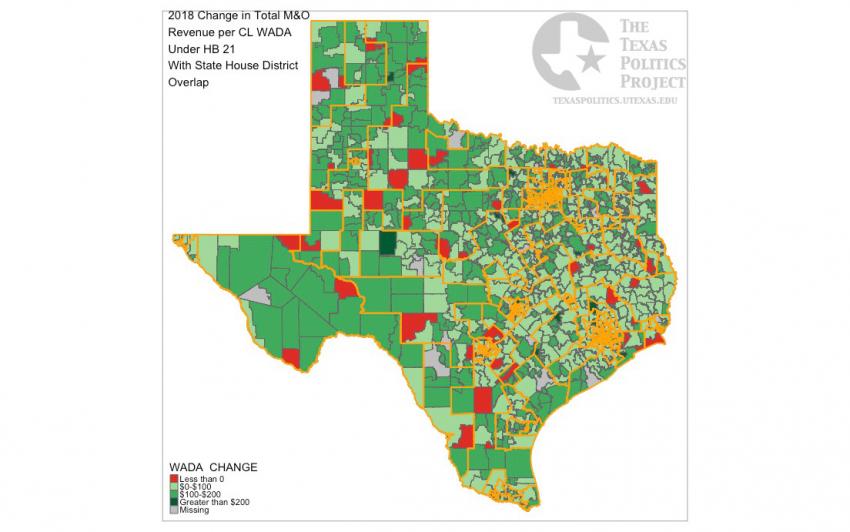
And finally, it's interesting to see which districts win and which districts lose in light of State Senate and House Districts. Obviously, at this scale, the House maps are of limited usefulness without urban details. We'll work on it, but amidst all the political churn, we thought it best to get these first products out before everyone's attention turns to something else. The maps are jpg files -- as always, feel free to cut and paste into your presentations and handouts. Like everyone else, we'd appreciate credit if you use them.


